

Gnuplot is a command-line tool that can generate two and three-dimensional plots for functions and data files
Install gnuplot
To install gnuplot, open the terminal by ctrl+alt+t and type this command >sudo apt install gnuplot
You can check gnuplot is install or not by command >gnuplot

Where to type gnuplot command on Linux
Open Linux terminal and type command >gnuplot to see gnuplot terminal on Linux and to exit gnuplot terminal type command > quit or exit
Set terminal type
First set the terminal type, which you would like to use, every terminal have a different set of features
To see the list of the terminals on Linux, type the command
>set terminal

You can use any terminal type which is listed but by default the terminal type will be ‘qt’on Linux and to use new terminal type the command
>set term wxt
The above command show wxt terminal type you choose any terminal as you like
For example
Every terminal type has different features
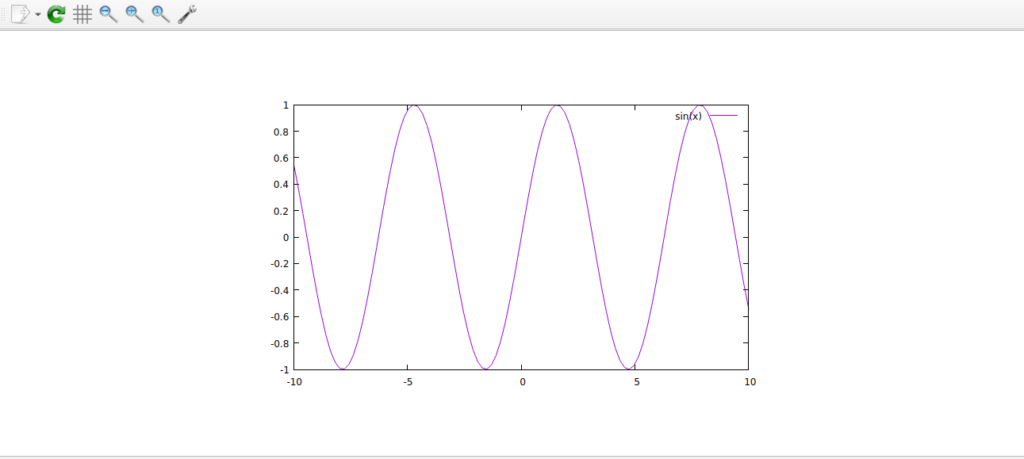
For terminal type qt
The command >plot sin(x) produces output like this
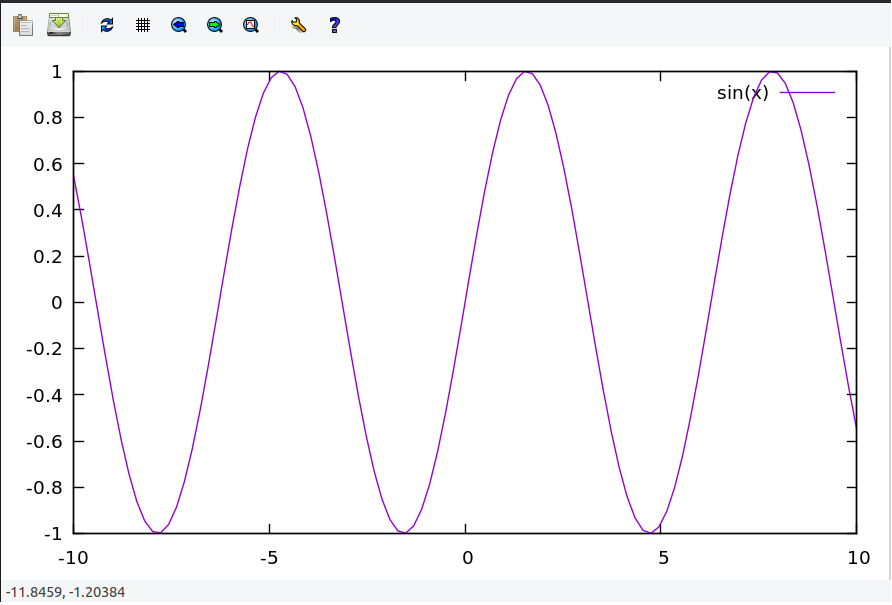
When the terminal type changed from ‘qt’ to ‘wxt’ the same command >plot sin(x) produces different output bar on the graph
Plotting functions to graph
>plot sin(x)
>plot sin(x) with points
>plot cos(x)
>plot sin(x),cos(x)
>plot sin(x),cos(x),exp(x)
>plot sin(x),tan(x),log(x)
Plotting expressions
>plot x**2
Customize plot
>set xrange[-1:13]
>set yrange[-1:15]
>Set xlabel “time”
>set ylabel “water level in cm”
>replot
>clear
Linetype, color’s and styles
Every terminal type provides different linetype, color, and style, the default line types for a particular terminal can be viewed by command >test

You can use the above chat by commands
For example:
>plot sin(x) linecolor 15
>plot sin(x) dashtype 3
>plot sin(x) linewidth 6
>plot ‘date.dat’ with lines
By using the chart above you can enter the required number of linecolor, dashtype, linewidth
Plotting data
Plotting of data can be done in gnuplot by setting the directory in the right order
Creating a dat file
The dat file can be created by using text editor on Linux
For example:
# date.dat
# X Y
8 9
8 5
4 7
9 5
2 6
8 7
9 1
2 0
Save the data in a text editor by file name date.dat
Remember # is a comment
Set the directory
The file date.dat can be plotted by setting directory in the right order which means the place where date.dat file is saved
Open the folder where you have saved the date.dat file on Linux terminal by using commands like ls, cd, cd..

As soon as you reached the folder where you have saved the date.dat file, that means the directory is set in right order, when the directory is set then typed the command> gnuplot and plot date.dat file by command> plot ‘date.dat’
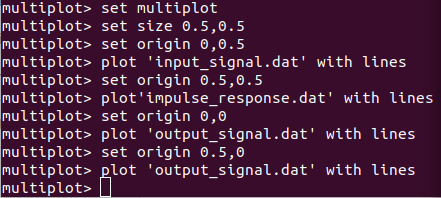
Multiplot
In order to use multiplot in Gnuplot we need to use a command called > set multiplot and to use four-quadrant >set size to 0.5,0.5
1: quadrant >set origin 0,0.5
2: quadrant >set origin 0.5,0.5
3: quadrant >set origin 0,0
4: quadrant >set origin 0.5,0

Leave a Reply