

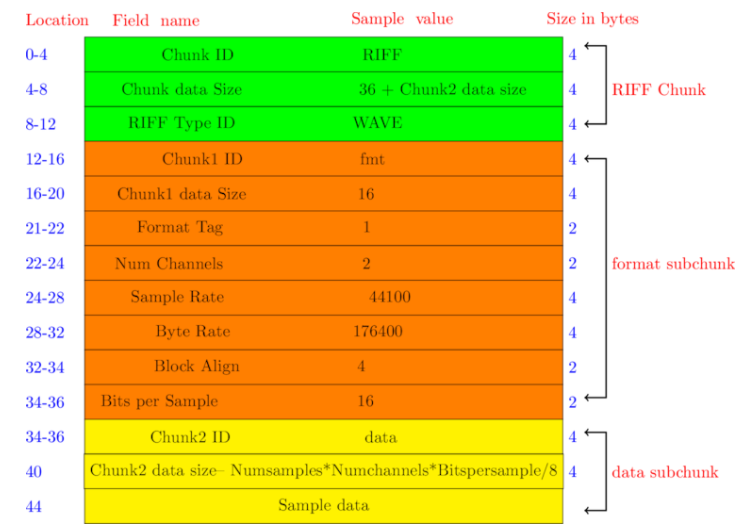
Wave file format
\documentclass{article}
\usepackage{tikz}
\begin{document}
\begin{tikzpicture}
\draw [thick, <->][xshift=6.5cm][yshift=-1.6cm] (-0.5,1.8) -- (0,1.8) -- (0,0) -- (-0.5,0);
\draw [thick, <->][xshift=6.5cm][yshift=-7.9cm] (-0.5,5.5) -- (0,5.5) -- (0,0) -- (-0.5,0);
\draw [thick, <->][xshift=6.5cm][yshift=-10.5cm] (-0.5,1.8) -- (0,1.8) -- (0,0) -- (-0.5,0);
\node [right,red] at (5,0.8) {Size in bytes};
\node [right,red] at (6.5,-0.8) {RIFF Chunk};
\node [right,red] at (0.5,0.8) {Sample \ value};
\node [right,red] at (-5,0.8) {Field \ name};
\node [right,red] at (-7,0.8) {Location };
\node [right,blue] at (5.5,0.0) { 4 };
\node [right,blue] at (-7,0.0) {0-4 };
\node [right,blue] at (-7,-0.8) {4-8 };
\node [right,blue] at (5.5,-0.8) { 4 };
\node [right,blue] at (-7,-1.6) {8-12 };
\node [right,blue] at (5.5,-1.6) { 4 };
\node [right,blue] at (-7,-2.4) {12-16 };
\node [right,blue] at (5.5,-2.4) { 4 };
\node [right,blue] at (-7,-3.2) {16-20 };
\node [right,blue] at (5.5,-3.2) { 4 };
\node [right,blue] at (-7,-4) {21-22 };
\node [right,blue] at (5.5,-4) { 2 };
\node [right,blue] at (-7,-4.8) {22-24 };
\node [right,blue] at (5.5,-4.8) { 2 };
\node [right,red] at (6.5,-4.8) {format subchunk};
\node [right,blue] at (-7,-5.6) {24-28 };
\node [right,blue] at (5.5,-5.6) { 4 };
\node [right,blue] at (-7,-6.4) {28-32 };
\node [right,blue] at (5.5,-6.4) { 4 };
\node [right,blue] at (-7,-7.2) {32-34 };
\node [right,blue] at (5.5,-7.2) { 2 };
\node [right,blue] at (-7,-8) {34-36};
\node [right,blue] at (5.5,-8) { 2 };
\node [right,blue] at (-7,-8.8) {34-36};
\node [right,blue] at (5.5,-8.8) { 4 };
\node [right,blue] at (-7,-9.6) {40};
\node [right,blue] at (5.5,-9.6) { 4 };
\node [right,red] at (6.5,-9.6) {data subchunk};
\node [right,blue] at (-7,-10.4) {44};
\draw (0,0) node[minimum height=0.8cm,minimum width=11cm,draw][fill=green] {Chunk ID  \ \ \ \ \ \ \ \ \ \ \ \ \ \ \ \ \ \ \ \ \ \   RIFF \ \ \ \ \ \ \ \ \ \ \ \ \ \ \ };
\draw (0,-0.8) node[minimum height=0.8cm,minimum width=11cm,draw][fill=green] {Chunk data Size  \ \ \ \  \ \
 \ \ \ \ \ \ \ \ \ \ \ \ \ \  36 + Chunk2 data size};
\draw (0,-1.6) node[minimum height=0.8cm,minimum width=11cm,draw][fill=green] {RIFF Type ID \ \ \ \  \  \ \ \ \ \ \
 \ \ \ \ \ \ \ \ \     WAVE \ \ \ \ \ \ \ \ \ \  \ \  \ \ \ \ \ \ \ \ \   };
\draw (0,-2.4) node[minimum height=0.8cm,minimum width=11cm,draw][fill=orange] { \ \ \ \ \ \ \  Chunk1 ID  \ \ \ \ \ \ \ \  \ \ \
   \  \  \ \  \ \  \ \ \ fmt  \ \ \ \ \ \ \ \ \ \ \ \ \ \ \ \ \ \ \ \ \ \ \ \  \   };
\draw (0,-3.2) node[minimum height=0.8cm,minimum width=11cm,draw][fill=orange] {  Chunk1 data Size \ \ \ \ \ \ \ \ \ \ \ \ \ \ \ \ \ \ \ 16\ \ \ \  \ \ \ \ \ \ \ \ \ \ \ \ \ \ \ \ \ \ \  \ \ \ \ \ \ };
\draw (0,-4) node[minimum height=0.8cm,minimum width=11cm,draw][fill=orange] {Format Tag  \ \ \ \ \ \ \ \ \ \ \ \ \ \ \ \ \
   \ \  \ \  \ \ \ 1 \ \ \ \ \ \ \ \ \ \ \ \ \ \ \ \ \  \ \ \ \ \ \ \ \   };
\draw (0,-4.8) node[minimum height=0.8cm,minimum width=11cm,draw][fill=orange] {Num Channels  \ \ \ \ \ \ \ \ \
   \ \ \ \ \ \ \ \ \ \ \ \ \ \ \  2 \ \ \ \ \ \ \ \ \ \ \ \ \ \ \ \ \ \ \ \ \ \ \ \ \ \ \  \ \   };
\draw (0,-5.6) node[minimum height=0.8cm,minimum width=11cm,draw][fill=orange] { \ \ \ \  Sample Rate  \ \ \ \ \ \ \ \ \ \ \ \ \ \ \ \ \ \ \ \
   \ \  \ \ \ 44100  \ \ \ \ \ \ \ \ \ \ \ \ \ \ \ \ \ \ \ \ \ \ \ };
\draw (0,-6.4) node[minimum height=0.8cm,minimum width=11cm,draw][fill=orange] { \ \ \ \ \ \ \ \  Byte Rate
   \ \  \ \ \ \ \ \ \ \ \ \ \ \ \ \ \ \ \ \ \   176400 \ \ \ \ \ \ \ \ \ \ \  \ \ \ \ \ \ \ \ \ \ \   \ \  };
\draw (0,-7.2) node[minimum height=0.8cm,minimum width=11cm,draw][fill=orange] {  \ \ \ \ \ \ \ \  Block Align   \ \ \ \ \ \ \ \ \ \
  \ \ \ \ \ \ \ \ \ \   4 \ \ \ \ \ \ \ \ \ \ \ \ \ \ \ \ \ \  \ \ \ \ \ \ \  \ \ \ \ \ \    };
\draw (0,-8) node[minimum height=0.8cm,minimum width=11cm,draw][fill=orange] {Bits per Sample
   \ \  \ \ \  \ \ \ \ \ \ \ \ \ \ \ \ \ \ \ \ \ \ \  16 \ \ \ \ \ \ \ \ \ \  \ \ \ \ \ \ \ \ \ \ \ \  \ \ \ \ \ \ \ \ \  };
\draw (0,-8.8) node[minimum height=0.8cm,minimum width=11cm,draw][fill=yellow] {Chunk2 ID  \ \ \ \ \ \ \ \ \ \ \ \ \ \ \ \ \ \
   \ \  \ \ \ data \ \ \ \ \ \ \ \ \ \ \ \ \ \ \ \ \ \  };
\draw (0,-9.6) node[minimum height=0.8cm,minimum width=11cm,draw][fill=yellow] {Chunk2 data size-- Numsamples*Numchannels*Bitspersample/8  };
\draw (0,-10.4) node[minimum height=0.8cm,minimum width=11cm,draw][fill=yellow] {Sample data };
\end{tikzpicture}
\end{document}
4 band resistor
\documentclass{article}
\usepackage{tikz}
\begin{document}
\begin{tikzpicture}
\newcommand\Stripe[2]{\draw[fill=#2,#2] ++(#1,0) +(-0.15,-0.71) rectangle +(0.15,0.71);}
% \stripe{offset}{color} short stripe
\newcommand\stripe[2]{\draw[fill=#2,#2] ++(#1,0) +(-0.15,-0.51) rectangle +(0.15,0.51);}
  % wire
  \draw[gray,fill=gray!40] (-3,-0.2) rectangle (3,0.2);
  % resistor
  \draw[rounded corners,thick,gray,fill=gray!20]
  ++(0,0.5) -- ++(1.5,0) -- ++(0.2,0.2) -- ++(0.8,0)
  .. controls +(0.2,-0.5) and +(0.2,0.5) .. ++(0,-1.4) -- ++(-0.8,0)
  -- ++(-0.2,0.2) -- ++(-3,0) -- ++(-0.2,-0.2) -- ++(-0.8,0)
  .. controls +(-0.2,0.5) and +(-0.2,-0.5) .. ++(0,1.4) -- ++(0.8,0)
  -- ++(0.2,-0.2) -- cycle;
  \Stripe{-2.1}{brown!80!gray}
  \Stripe{2.1}{yellow!50!gray}
  \stripe{-1.2}{green}
  \stripe{0.2}{red}
\end{tikzpicture}
\end{document}
Block diagrams
\documentclass{article}
\usepackage{tikz}
\begin{document}
\begin{tikzpicture}[outline/.style={draw=#1,thick,fill=#1!50}]
\node [left,red] at (-0.6,-0.4) {$float \  Array [6] $};
\draw [thick, <->] (0,-0.8) -- (4.7,-0.8);
\node [left,red][yshift=2cm] at (4.3,-3.2) {$same \ datatype$};
\node [outline=violet] at (-0,-0.4) {float};
\node [outline=violet] at (1,-0.4) {float};
\node [outline=violet] at (2,-0.4) {float};
\node [outline=violet] at (3,-0.4) {float};
\node [outline=violet] at (4,-0.4) {float};
\node [outline=violet] at (5,-0.4) {float};
\end{tikzpicture}

\end{document}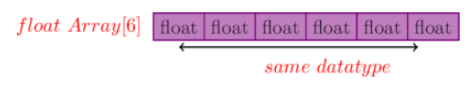
Duck example for recursion concept
\documentclass{article}
\usepackage{tikz}
\usetikzlibrary{ducks}
\begin{document}
\begin{tikzpicture}[xscale=-1]
\node [below left, red] at (-8.5,3.6) {Box 3};
\node [below left, red] at (-5.5,3.6) {Box 2};
\node [below left, red] at (-2,3.6) {Box 1};
\draw [thick,blue] (0,3) -- (-10,3);
\draw [thick,blue] (-3.3,1.5) -- (-3.3,3);
\draw [thick,blue] (-6.6,1.5) -- (-6.6,3);
\draw [thick,blue] (0,1.5) -- (-0,3);
\draw [thick,blue] (-10,-0.2) -- (-10,3);
\draw [fill=red] (-8,0.0) circle [radius=0.1];
\draw [fill=red] (-5,0.0) circle [radius=0.1];
\draw [fill=red] (-1.6,0.0) circle [radius=0.1];
\draw [thick,blue] (0,-0.2) -- (-10,-0.2);
    \duck[laughing]
\end{tikzpicture}
\begin{tikzpicture}
\node [below left, red] at (-6.5,3.6) {Box 1};
\node [below left, red] at (-3.5,3.6) {Box 2};
\node [below left, red] at (0,3.6) {Box 3};
\draw [thick,blue] (2,3) -- (-10,3);
\draw [thick,blue] (-5.7,1.5) -- (-5.7,3);
\draw [thick,blue] (-2,1.5) -- (-2,3);
\draw [thick,blue] (2,-0.2) -- (2,3);
\draw [thick,blue] (-10,1.5) -- (-10,3);
\draw [fill=red] (-8,0.0) circle [radius=0.1];
\draw [fill=red] (-4,0.0) circle [radius=0.1];
\draw [fill=red] (-0.6,0.0) circle [radius=0.1];
\draw [thick,blue] (2,-0.2) -- (-10,-0.2);
    \duck[laughing]
\end{tikzpicture}
\end{document}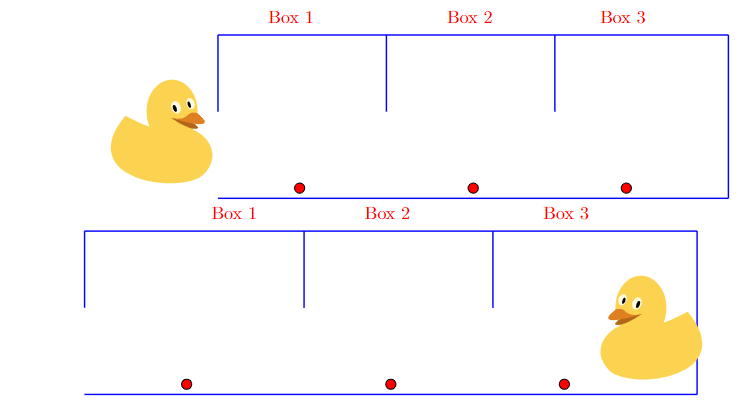
\documentclass{article}
\usepackage{tikz}
\begin{document}
\begin{tikzpicture}[outline/.style={draw=#1,thick,fill=#1!50}]
\node [left,red] at (-0.6,-0.4) {$int \  Array [6] $};
\draw [thick, <->] (0,-0.8) -- (3.5,-0.8);
\node [left,red][yshift=2cm] at (3.5,-3.2) {$same \ datatype$};
\node [outline=green] at (0,-0.4) {int};
\node [outline=green] at (0.7,-0.4) {int};
\node [outline=green] at (1.4,-0.4) {int};
\node [outline=green] at (2.1,-0.4) {int};
\node [outline=green] at (2.8,-0.4) {int};
\node [outline=green] at (3.5,-0.4) {int};

\end{tikzpicture}

\end{document}
\documentclass{article}
\usepackage{tikz}
\begin{document}
\begin{tikzpicture}
\definecolor{blue1}{HTML}{6095C9}
\definecolor{blue2}{HTML}{55779A}
\matrix [column sep=10mm, row sep=8mm, every node/.style={
    shape=rectangle,text width=2.75cm, minimum height=1.75cm,text centered,
    font=\sffamily\small, very thick,color=red,draw=black,fill=yellow,
}] {
  \node (a1) {Amplifier }; &

   \\
};
\begin{scope}[->, very thick, blue1]
  \draw (1,0) -- (3,0)  node [midway, above, sloped](TextNode) {o/p=20 w} ;
 \draw (-4,0) -- (-2,0)  node [midway, above, sloped](TextNode) {i/p=10 w} ;

  \end{scope}\end{tikzpicture}

\end{document}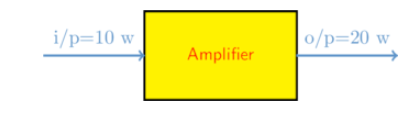
\documentclass{article}
\usepackage{tikz}
\begin{document}
\begin{tikzpicture}
\definecolor{blue1}{HTML}{6095C9}
\definecolor{blue2}{HTML}{55779A}
\matrix [column sep=4mm, row sep=8mm, every node/.style={
    shape=rectangle,text width=2cm, minimum height=1.75cm,text centered,
    font=\sffamily\small, very thick,color=red,draw=black,fill=yellow,
}] {
  \node (a1) {ios}; &
  \node (a2) { streambuf}; &\\
  \node (a3) { istream}; &
  \node (a4) { fstreambase}; &
  \node (a5) { strstreambase}; &
  \node (a6) { ostream}; &
  \node (a7) {filebuf}; &
  \node (a8) {strstreambuf}; &\\
  \node (a9) { ifstream}; &
  \node (a10) { iostream}; &
  \node (a11) {ofstream}; &\\
  \node (a12) {istrstream}; &
  \node (a13) {fstream}; &
  \node (a14) {ostrstream};\\
};
\begin{scope}[->, very thick, blue1]
  \draw[->, thick] (a2) -- (a1);
  \draw[->, thick] (a2) -- (a7);
  \draw[->, thick] (a2) -- (a8);
  \draw[->, thick] (a1) -- (a5);
  \draw[->, thick] (a1) -- (a6);
  \draw[->, thick] (a1) -- (a4);
  \draw[->, thick] (a1) -- (a3);
  \draw[->, thick] (a3) -- (a9);
  \draw[->, thick] (a4) -- (a9);
  \draw[->, thick] (a3) -- (a10);
  \draw[->, thick] (a6) -- (a10);
  \draw[->, thick] (a6) -- (a11);
  \draw[->, thick] (a4) -- (a11);
  \draw[->, thick] (a3) -- (a12);
  \draw[->, thick] (a5) -- (a12);
  \draw[->, thick] (a10) -- (a13);
  \draw[->, thick] (a4) -- (a13);
  \draw[->, thick] (a5) -- (a14);
  \draw[->, thick] (a6) -- (a14);

  \end{scope}\end{tikzpicture}

\end{document}
\documentclass{article}
\usepackage{tikz}
\begin{document}
\begin{tikzpicture}
\definecolor{blue1}{HTML}{6095C9}
\definecolor{blue2}{HTML}{55779A}
\matrix [column sep=10mm, row sep=8mm, every node/.style={
    shape=rectangle,text width=2.75cm, minimum height=1.75cm,text centered,
    font=\sffamily\small, very thick,color=red,draw=black,fill=yellow,
}] {
  \node (a1) {Time Domain}; &
  \node (a2) { IDFT}; &
  \node (a3) {Frequency Domain}; \\
};
\begin{scope}[->, very thick, blue1]
  \draw (a2) -- (a1);
  \draw (a3) -- (a2);
  \end{scope}\end{tikzpicture}

\end{document}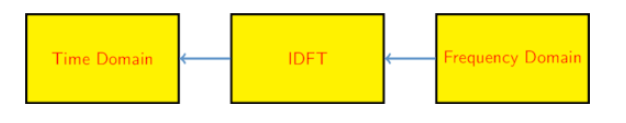
\documentclass{article}
\usepackage{tikz}
\begin{document}
\begin{tikzpicture}
\definecolor{blue1}{HTML}{6095C9}
\definecolor{blue2}{HTML}{55779A}
\matrix [column sep=10mm, row sep=8mm, every node/.style={
    shape=rectangle,text width=2.75cm, minimum height=1.75cm,text centered,
    font=\sffamily\small, very thick,color=red,draw=black,fill=yellow,
}] {
  \node (a1) {Time Domain}; &
  \node (a2) { DFT}; &
  \node (a3) {Frequency Domain}; \\
};
\begin{scope}[->, very thick, blue1]
  \draw (a1) -- (a2);
  \draw (a2) -- (a3);
  \end{scope}\end{tikzpicture}

\end{document}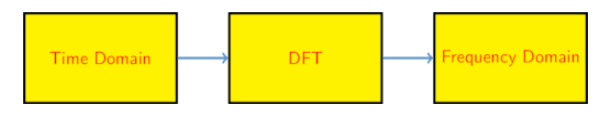
Steps for writing a c program
\documentclass{article}
\usepackage{tikz}
\begin{document}
\begin{tikzpicture}[font=\sffamily,pft/.style={align=left,
    alias=tmp,
    append after command={
    ([xshift=-1ex,yshift=0.5ex]\tikzlastnode.north west)
    edge[blue,line width=0.8ex,line cap=rect]
    ([xshift=-1ex,yshift=-0.5ex]\tikzlastnode.west)
    edge[blue,line width=0.8ex]
    ([xshift=2ex,yshift=0.5ex]\tikzlastnode.north east)
    coordinate(aux)
    }},pics/trian/.style={code={\fill (0ex,0ex) -- (0,0) |-cycle;}}]%
 \path node[pft] (zero) {step 1\\ Define \\the\\ program \\objectives}
 foreach \X in {2 Create a design,3 Write the code, 4 Compile, 5 Run the program, 6 Test /debug the program, 7 Maintain and modify the program }
 {node[right=50em of tmp.east,anchor=south west,pft](\X) {step\\ \X}
 ([xshift=10ex,yshift=0.9ex]\X.north west) pic[blue]{trian}};
\end{tikzpicture}
\end{document}
Mininet topology
\documentclass{article}
\usepackage{tikz}
\begin{document}
\begin{tikzpicture}
\draw [fill=red, ultra thick,red] (-4,1) circle [radius=1];
\node at (-4,1) {Router};
\draw (6,1) --(-3,1);
\draw (-6.5,1) --(-5,1);
\draw [fill=pink] (-2,-1) rectangle (-1,-0);
\draw (2,0) ellipse (5cm and 2cm);
\node at (-1.5,-0.5) {A};
\draw (-1.5,1) --(-1.5,0);
\node at (-2.5,0.2) {11.1.1.2/24};
\node at (-2.5,-0.5) {MA};
\node at (-2.5,0.8) {11.1.1.1/24};
\node at (-2.5,1.5) {M2};
\node at (-6.5,0.8) {10.1.1.1/24};
\node at (-6.5,1.5) {M1};
\draw [fill=pink] (0,-1) rectangle (1,-0);
\node at (0.5,-0.5) {B};
\draw (0.5,1) --(0.5,0);
\node at (-0.4,0.2) {11.1.1.3/24};
\node at (-0.5,-0.5) {MB};
\draw [fill=pink] (2,-1) rectangle (3,-0);
\node at (2.5,-0.5) {C};
\draw (2.5,1) --(2.5,0);
\node at (1.5,0.2) {11.1.1.4/24};
\node at (1.5,-0.5) {MC};
\draw [fill=pink] (4,-1) rectangle (5,-0);
\node at (4.5,-0.5) {D};
\draw (4.5,1) --(4.5,0);
\node at (5.5,0.2) {11.1.1.5/24};
\node at (5.5,-0.5) {MD};
\end{tikzpicture}
\end{document}
\documentclass[tikz,border=500pt]{standalone}
\usetikzlibrary{shapes.symbols}
\begin{document}
\begin{tikzpicture}
\node at (-8.6,0.8)[starburst, draw, minimum width=5cm, minimum height=4cm,red,fill=cyan,line width=2pt]
{internet};% internet star
\draw [fill=red, ultra thick,red] (-4,1) circle [radius=1];
\node at (-4,1) {Router};
\draw (4,1) --(-3,1);
\draw (-6.5,1) --(-5,1);
\draw [fill=pink] (-2,-1) rectangle (-1,-0);
\node at (-1.5,-0.5) {A};
\draw (-1.5,1) --(-1.5,0);
\node at (-2.5,0.2) {11.1.1.2/24};
\node at (-2.5,-0.5) {MA};
\node at (-2,1.2) {11.1.1.1/24};
\node at (-2.5,1.7) {MR};

\draw [fill=pink] (0,3) rectangle (1,2);
\node at (0.5,2.5) {B};
\draw (0.5,1) --(0.5,2);
\node at (1.5,1.7) {11.1.1.3/24};
\node at (1,1.4) {MB};
\draw [fill=pink] (2,-1) rectangle (3,-0);
\node at (2.5,-0.5) {C};
\draw (2.5,1) --(2.5,0);
\node at (1.5,0.2) {11.1.1.4/24};
\node at (1.5,-0.5) {MC};
\end{tikzpicture}
\end{document}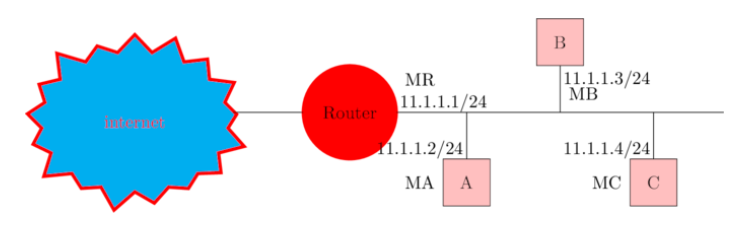
\documentclass{article}
\usepackage{tikz}
\usetikzlibrary{shapes.symbols}
\begin{document}
\begin{tikzpicture}
\node at (-8.6,0.8)[starburst, draw, minimum width=5cm, minimum height=4cm,red,fill=cyan,line width=2pt]
{internet};% internet star
\draw [fill=red, ultra thick,red] (-4,1) circle [radius=1];
\node at (-4,1) {Router};
\draw (0,1) --(-3,1); router line
\draw (-6.5,1) --(-5,1);
\draw [fill=pink] (4.5,1.5) rectangle (5.5,0.5);% A rectangle
\node at (5,1) {A};
\draw (4.5,1) --(3,1);% A line
\node at (4.5,0.2) {12.1.1.2/24};%A
\node at (4,1.2) {MA};
\node at (3.2,1.2) {P3};
\node at (-0.4,1.2) {P1};
\node at (4,1.5) {IFA};
\node at (-2,1.2) {12.1.1.4/24};
\node at (-2.5,1.7) {MR};
\node at (-2.5,2.2) {IFR};
\draw [fill=pink] (0,2) rectangle (3,-0);% SQUARE switch

\draw [fill=pink] (2,4) rectangle (1,5);% B rectangle
\node at (1.5,4.5) {B};
\node at (1.5,1.2) {L2 Switch};
\draw (1.5,4) --(1.5,2); % B line
\node at (3.1,4.4) {12.1.1.3/24};%B
\node at (2,3.4) {MB};
\node at (2,3) {IFB};
\node at (2,2.4) {P4};
\draw [fill=pink] (2,-2) rectangle (1,-3);% C sQUARE
\node at (1.5,-2.5) {C};
\draw (1.5,-2) --(1.5,-0); C line
\node at (3,-2.5) {12.1.1.1/24};%c
\node at (2,-1.8) {MC};
\node at (2,-1.5) {IFC};
\node at (2,-0.5) {P2};
\end{tikzpicture}
\end{document}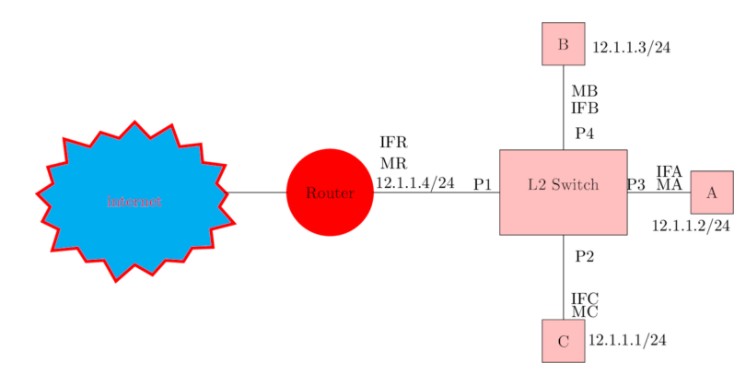
\documentclass{article}
\usepackage{tikz}
\usetikzlibrary{shapes.symbols}
\begin{document}
\begin{tikzpicture}
\draw [rotate=90](1,-0) ellipse (120pt and 100pt);
\node at (-9.6,0.8)[starburst, draw, minimum width=5cm, minimum height=4cm,red,fill=cyan,line width=2pt]% internet star
{internet};
\draw [fill=red, ultra thick,red] (-5,1) circle [radius=1];% router circle
\node at (-5,1) {Router};% router text
\draw (4,1) --(-4,1);% main line
\draw (-7.5,1) --(-6,1);% internet line
\draw [fill=pink] (-2,-1) rectangle (-1,-0);
\node at (-1.5,-0.5) {A};
\draw (-1.5,1) --(-1.5,0);
\node at (-2.5,0.2) {12.1.1.2/24};
\node at (-2.5,-0.5) {MA};
\node at (-2.5,-0.8) {IFA};
\node at (-3.1,1.2) {12.1.1.4/24};
\node at (-3.8,1.7) {MR};
\node at (-3.8,2) {IFR};

\draw [fill=pink] (0,3) rectangle (1,2);
\node at (0.5,2.5) {B};
\node at (0.5,4) {Network id =12.1.1.0/24};
\node at (0.5,5.5) {LAN};
\draw (0.5,1) --(0.5,2);
\node at (1.5,1.7) {12.1.1.3/24};
\node at (1,1.4) {MB};
\node at (0,1.4) {IFB};
\draw [fill=pink] (2,-1) rectangle (3,-0);
\node at (2.5,-0.5) {C};
\draw (2.5,1) --(2.5,0);
\node at (1.5,0.2) {12.1.1.1/24};
\node at (1.5,-0.5) {MC};
\node at (1.5,-0.8) {IFC};
\end{tikzpicture}
\end{document}
\documentclass[tikz,border=500pt]{standalone}
\usetikzlibrary{shapes.symbols}
\begin{document}
\begin{tikzpicture}
\node at (-3.,0.8)[starburst, draw, minimum width=2.5cm, minimum height=2cm,red,fill=cyan,line width=1pt]
{internet};
\draw [fill=red, ultra thick,red] (-0,1) circle [radius=0.5];%r2 router
\node at (-0,1) {L3-$R_2$};
\draw [fill=red, ultra thick,red] (-6,1) circle [radius=0.5];%r1 router
\node at (-6,1) {L3-$R_1$};
\draw (4,1) --(0.5,1);% r2 right line
\draw (-10,1) --(-6.5,1);% r1 left line
\draw (-1.9,1) --(-0.5,1);% internet right line
\draw (-4.1,1) --(-5.5,1);% internet left line
\draw [fill=yellow] (1.8,-1) rectangle (2.3,-0.5);
\node at (2,-0.7) {O};
\draw (2,1) --(2,-0.5);
\node at (1,0.2) {12.1.1.2/24};
\node at (1,-0.5) {MO};
\draw [fill=yellow] (-7.8,-1) rectangle (-8.3,-0.5);
\node at (-8,-0.7) {L};
\draw (-8,1) --(-8,-0.5);
\node at (-7,0.2) {11.1.1.1/24};
\node at (-7,-0.5) {ML};
\node at (-1.5,1.8) {12.1.1.4/24};
\node at (-1.5,1.5) {M$R_2$};
\node at (-4.5,1.8) {11.1.1.4/24};
\node at (-4.5,1.5) {M$R_1$};

\draw [fill=yellow] (2.7,3) rectangle (3.2,2.5);
\node at (2.9,2.7) {P};
\draw (2.9,1) --(2.9,2.5);
\node at (1.9,1.7) {12.1.1.3/24};% IP address of p device
\node at (1.5,1.4) {MP};
\node at (1.5,3) {Dst subnet B};% IP address of p device
\node at (1.5,2.5) {12.1.1.0/24};

\draw [fill=yellow] (-8.7,3) rectangle (-9.2,2.5);
\node at (-8.9,2.7) {N};
\draw (-8.9,1) --(-8.9,2.5);
\node at (-7.9,1.7) {11.1.1.3/24};
\node at (-7.5,1.4) {MN};
\node at (-7.5,3) {Src subnet A};
\node at (-7.5,2.5) {11.1.1.0/24};
\draw [fill=yellow] (-8.7,5) rectangle (-7.2,5.5);
\node at (-8,5.2) {N$\rightarrow R_1$ };
\node at(-8,4.5)[blue] {$L_2$ Routing };

\draw [fill=yellow] (-3.7,5) rectangle (-2.2,5.5);
\node at (-3,5.2) {$R_1\rightarrow R_2$ };
\node at(-3,4.5)[blue] {$L_3$ Routing };

% yellow box of l2 routing
\draw [fill=yellow] (2.7,5) rectangle (1.2,5.5);
\node at (2,5.2) {$R_2\rightarrow P$ };
\node at(2,4.5)[blue] {$L_2$ Routing };
% red lines of l2 routing
\draw [red](-8.9,4) --(-6,4);
\draw [red](-8.9,4) --(-8.9,3.5);
\draw [red](-6,4) --(-6,3.5);
% red lines of l3 routing
\draw [red](-5.8,4) --(-0,4);
\draw [red] (-0,4) --(-0,3.5);
\draw [red](-5.8,4) --(-5.8,3.5);
% red lines of l2 routing
\draw [red](0.2,4) --(3,4);
\draw [red] (0.2,4) --(0.2,3.5);
\draw [red](3,4) --(3,3.5);
\draw [fill=yellow] (3.5,-1) rectangle (4,-0.5);
\draw [fill=yellow] (-9.5,-1) rectangle (-10,-0.5);
\node at (3.8,-0.7) {Q};
\draw (3.8,1) --(3.8,-0.5);
\draw (-9.8,1) --(-9.8,-0.5);
\node at (-9.8,-0.7) {M};
\node at (2.9,0.2) {12.1.1.1/24};
\node at (3.0,-0.5) {MQ};
\node at (-8.9,0.2) {11.1.1.2/24};
\node at (-8.8,-0.5) {MM};
\end{tikzpicture}
\end{document}
\documentclass{article} % say
\usepackage{tikz}
\begin{document}
\begin{tikzpicture}
\draw [fill=red, ultra thick,red] (2,1) circle [radius=0.5];
\draw [fill=red, ultra thick,red] (-3,1) circle [radius=0.5];
\draw [fill=red, ultra thick,red] (7,1) circle [radius=0.5]  ;
\draw (1.5,1) --(-2.5,1);
\draw (2.5,1) --(6.5,1);
\node at (-2,0) {1.1.1.1/24};
\node at (-2,2) {$h_{1}$\_$eth_{0}$};
\node at (6,2) {$h_{2}$\_$eth_{0}$};
\node at (6,0) {1.1.1.2/24};
\node at (2,1) {S};
\node at (-3,1) {h1};
\node at (7,1) {h2};

\end{tikzpicture}
\end{document}
\documentclass{article}
\usepackage{tikz}
\begin{document}
\begin{tikzpicture}
\draw [fill=yellow,ultra thick,yellow] (-4,-1) rectangle (-2,1);
\node at (-3,0) {S1};
\draw [fill=yellow,ultra thick,yellow] (0,1) rectangle (2,3);
\node at (1,2) {S2};
\draw  (-1,2) -- (0,2);
\draw  (-1,2) -- (-1,0.5);
\draw [->] (-1,0.5) -- (-2,0.5);
\draw [fill=yellow,ultra thick,yellow] (0,-1) rectangle (2,-3);
\node at (1,-2) {S3};
\draw  (-1,-2) -- (0,-2);
\draw  (-1,-2) -- (-1,-0.5);
\draw [->] (-1,-0.5) -- (-2,-0.5);
\draw [fill=pink] (-6,-0.75) rectangle (-5,0.5);
\draw[->]  (-5,0) -- (-4,0);
\node at (-5.5,-0.2) {C0};
\draw [fill=red, ultra thick,red] (4,3) circle [radius=0.5];
\node at (4,3) {h1};
\draw  (3,3) -- (3.5,3);
\draw  (3,3) -- (3,2);
\draw[<-]  (2,2) -- (3,2);
\draw [fill=red, ultra thick,red] (4,1) circle [radius=0.5];
\node at (4,1) {h2};
\draw  (3,1) -- (3.5,1);
\draw  (3,1) -- (3,1.5);
\draw[<-]  (2,1.5) -- (3,1.5);
\draw [fill=red, ultra thick,red] (4,-1) circle [radius=0.5];
\node at (4,-1) {h3};
\draw  (3,-1) -- (3.5,-1);
\draw  (3,-1) -- (3,-2);
\draw[<-]  (2,-2) -- (3,-2);
\draw [fill=red, ultra thick,red] (4,-3) circle [radius=0.5];
\node at (4,-3) {h4};
\draw  (3,-3) -- (3.5,-3);
\draw  (3,-3) -- (3,-2.5);
\draw[<-]  (2,-2.5) -- (3,-2.5);
\end{tikzpicture}

\end{document}
\documentclass[tikz,border=10pt]{standalone}
\usepackage{type1cm}
\begin{document}
\begin{tikzpicture}

\tikzset{
  comp/.style = {
    minimum width  = 8cm,
    minimum height = 4.5cm,
    text width     = 8cm,
    inner sep      = 0pt,
    text           = green,
    align          = center,
    font           = \fontsize{64}{64}\selectfont,
    transform shape,
    thick
  },
  monitor/.style = {draw = none, xscale = 18/16, yscale = 11/9},
  display/.style = {shading = axis, left color = black!60, right color = black},
  ut/.style      = {fill = gray}
}
\tikzset{
  computer/.pic = {
    % screen (with border)
    \node(-m) [comp, pic actions, monitor]
      {\phantom{\parbox{\linewidth}{\tikzpictext}}};
    % display (without border)
    \node[comp, pic actions, display] {\tikzpictext};
    \begin{scope}[x = (-m.east), y = (-m.north)]
      % filling the lower part
      \path[pic actions, draw = none]
        ([yshift=2\pgflinewidth]-0.1,-1) -- (-0.1,-1.3) -- (-1,-1.3) --
        (-1,-2.4) -- (1,-2.4) -- (1,-1.3) -- (0.1,-1.3) --
        ([yshift=2\pgflinewidth]0.1,-1);
      % filling the border of the lower part
      \path[ut]
        (-1,-2.4) rectangle (1,-1.3)
        (-0.9,-1.4) -- (-0.7,-2.3) -- (0.7,-2.3) -- (0.9,-1.4) -- cycle;
      % drawing the frame of the whole computer
      \path[pic actions, fill = none]
        (-1,1) -- (-1,-1) -- (-0.1,-1) -- (-0.1,-1.3) -- (-1,-1.3) --
        (-1,-2.4) coordinate(sw)coordinate[pos=0.5] (-b west) --
        (1,-2.4) -- (1,-1.3) coordinate[pos=0.5] (-b east) --
        (0.1,-1.3) -- (0.1,-1) -- (1,-1) -- (1,1) -- cycle;
    \end{scope}
  }
}

        filldraw (0,4) node [below] {center here} circle (1pt);
        \node [draw,dashed, very thick, shape=rectangle, minimum width=10cm, minimum height=10cm, anchor=center] at (0,5) {};
        \pic(comp1) [draw,scale=0.2,fill = gray!20, pic text = {h2}] at (0,2) {computer};


        \pic(comp0) [draw,scale=0.2,fill = gray!20, pic text = {h1}] at (-0,9) {computer};

        \draw [fill=pink] (8,7) rectangle (12,3);
\node at (10,5) {L2 SWITCH S5};
\node at (0,10.5) {Vlan 10};
\node at (-2,8.5) {122.1.1.1/32};
\node at (-2,1.5) {122.1.1.2/32};
\node at (2,8.5) {h1-etho};
\node at (2,7.5) {10.0.10.1/24};
\node at (2,1.5) {h2-etho};
\node at (2,0.5) {10.0.10.2/24};
\node at (6,7) {S5-etho};
\node at (6,6.5) {Vlan 10 Acess};
\node at (6,5) {S5-eth1};
\node at (6,4.5) {Vlan 10 Acess};

        \draw[thick] (4,4) -- (8,4);
        \draw[thick] (4,4) -- (4,1);
        \draw[thick] (0.9,1) -- (4,1);
        \draw[thick] (4,6) -- (8,6);
        \draw[thick] (4,6) -- (4,8);
         \draw[thick] (0.9,8) -- (4,8);
    \end{tikzpicture}
\end{document}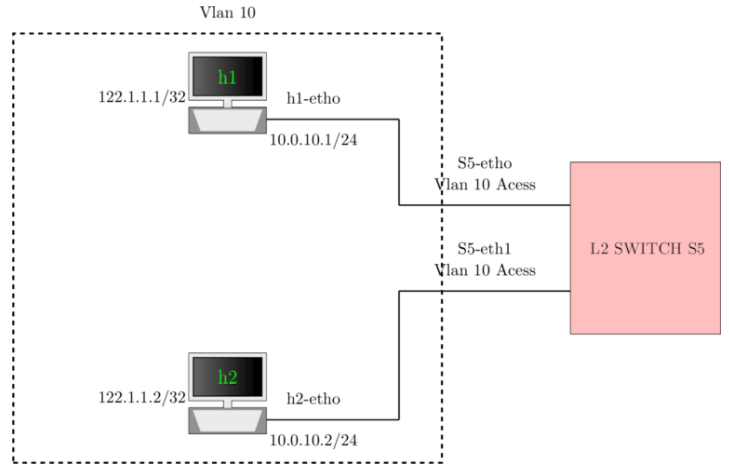
\documentclass{article}
\usepackage{tikz}
\usetikzlibrary{arrows,decorations.pathmorphing,backgrounds,positioning,fit,petri}
\begin{document}
\begin{tikzpicture}
\draw [->] (1.8,-1.5) --(3.6,-1.5);
\node at (-1.5,-1.5) {P};
\node at (1.5,-1.5) {S};
\node at (4,-1.5) {T};
\node at (0,0) {Q};
\node at (0,-3) {R};
\draw [fill=pink] (-1,1.5) rectangle (1,0.5);
\draw (0,1.5) --(0,0.5);
\node at (-0.5,1) {T};
\node at (0.5,1) {S};
\draw [fill=pink] (-1,-3.5) rectangle (1,-4.5);
\draw (0,-3.5) --(0,-4.5);
\node at (-0.5,-4) {T};
\node at (0.5,-4) {S};
\draw [fill=pink] (-4,-0.5) rectangle (-2,-1.5);
\draw (-3,-0.5) --(-3,-1.5);
\node at (-3.5,-1) {T};
\node at (-2.5,-1) {Q};
\draw [fill=pink] (1.8,-0.2) rectangle (3.8,-1.3);
\draw (2.8,-0.2) --(2.8,-1.3);
\node at (2.2,-0.8) {T};
\node at (3.2,-0.8) {T};
[bend angle=45,
pre/.style={<-,shorten <=1pt,>=stealth',semithick},
post/.style={->,shorten >=1pt,>=stealth',semithick}]
\node[place] (waiting 1) at ( 4,-1.5) {};
\node[place] (waiting) {};
\node[] (critical) [below=of waiting] {};
\node[place] (semaphore) [below=of critical] {};
\node[place] (leave critical) [right=of critical] {}
edge [post,bend right] (waiting)
edge [pre, bend left] (semaphore);
\node[place] (enter critical) [left=of critical] {}
edge [pre, bend left] (waiting)
edge [post,bend right] (semaphore);
\end{tikzpicture}
\end{document}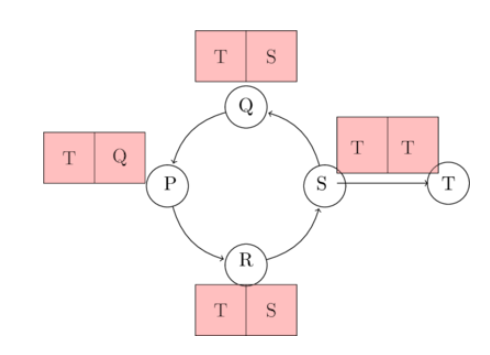
Local subnet and remote subnet
\documentclass{article}
\usepackage{tikz}
\begin{document}
\begin{tikzpicture}
\draw [fill=red, ultra thick,red] (-3,-8) circle [radius=0.5];
\draw [fill=red, ultra thick,red] (-3,1) circle [radius=0.5];
\draw [fill=red, ultra thick,red] (7,1) circle [radius=0.5]  ;
\draw [rotate=90](1,-2) ellipse (30pt and 80pt);
\node at (2,1.5) {192.168.1.0};
\node [rotate=270] at (-2.5,-4) {192.168.4.0};
\node at (2,0.5) {$\backslash 24$};
\node [rotate=270] at (-3.5,-4) {$\backslash 24$};
\draw (-3,-3.5) ellipse (30pt and 80pt);
\draw (6.5,1) --(-2.5,1);
\draw (-3,-7.5) --(-3,0.5);
\node at (-2,1.5) {192.168.1.1/24};
\node at (-4.5,0) {192.168.4.1/24};
\node at (-1.5,-6.5) {192.168.4.2/24};
\node at (-4,-0.5) {$eth_{2}$};
\node at (-2,2) {$eth_{3}$};
\node at (-2,-7) {$eth_{2}$};
\node at (6,-0.5) {$eth_{3}$};
\node at (6,0) {192.168.1.2/24};
\node at (-3,-8) {vm};
\node at (-3,1) {vm1};
\node at (7,1) {vm2};
\end{tikzpicture}
\end{document}
Tree data structure (binary tree)
\documentclass{article}
\usepackage{tikz}
\begin{document}
\begin{tikzpicture}
[parent anchor=south,child anchor=north,grow=south]
\tikzstyle{every node}=[ball color=red,circle,text=white]
\tikzstyle{edge from parent}=[draw,dashed,thick,red]
\node {A}
child {node {B}
child {node {D}
}
child {node {E}
}
}
child {node {C}
child [missing]
child {node {F}
child[missing]
}
child {node {G}}
};
\end{tikzpicture}
\end{document}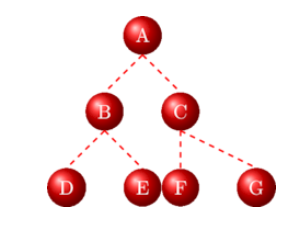
Tree example has nodes from A to O
\documentclass{article}
\usepackage{tikz}
\begin{document}
\begin{tikzpicture}
\draw [blue,thick, <->] (5,-10.5) -- (5,-1);
\draw [blue,thick, <->] (-5,-10.5) -- (-5,-1);
\node [purple,below] at (-5,0) {Height};
\node [purple,below] at (5,0) {Level};
\node [purple,below] at (0,0) {Root};
\draw [dashed,blue] (-5,-2) -- (5,-2);
\node [purple] at (5.4,-2) {1};
\node [purple] at (-5.4,-2) {0};
\draw [dashed,blue] (-5,-4.1) -- (5,-4.1);
\node [purple] at (5.4,-4.1) {2};
\node [purple] at (-5.4,-4.1) {1};
\draw [dashed,blue] (-5,-6.1) -- (5,-6.1);
\node [purple] at (5.4,-6.1) {3};
\node [purple] at (-5.4,-6.1) {2};
\draw [dashed,blue] (-5,-8.1) -- (5,-8.1);
\node [purple] at (5.4,-8.1) {4};
\node [purple] at (-5.4,-8.1) {5};
\draw [dashed,blue] (-5,-10.1) -- (5,-10.1);
\node [purple] at (5.4,-10.1) {5};
\node [purple] at (-5.4,-10.1) {4};
\draw [red, ultra thick] (0,-2) node[minimum size=1cm,draw,circle] {A};
\draw[->] (0,-2.5) -- (-2,-3.5);
\draw [red, ultra thick] (-2,-4.1) node[minimum size=1cm,draw,circle] {B};
\draw[->] (0,-2.5) -- (-0,-3.5);
\draw[->] (-2,-4.6) -- (-4,-5.6);
\draw [red, ultra thick] (-4,-6.1) node[minimum size=1cm,draw,circle] {E};
\draw [red, ultra thick] (-0,-4.1) node[minimum size=1cm,draw,circle] {C};
\draw[->] (0,-2.5) -- (2,-3.5);
\draw[->] (-0,-4.6) -- (0,-5.6);
\draw [red, ultra thick] (-0,-6.1) node[minimum size=1cm,draw,circle] {F};
\draw[->] (-0,-6.6) -- (-2,-7.6);
\draw [red, ultra thick] (-2,-8.1) node[minimum size=1cm,draw,circle] {J};
\draw[->] (-0,-6.6) -- (-0,-7.6);
\draw[->] (-2,-8.6) -- (-2,-9.6);
\draw [red, ultra thick] (-2,-10.1) node[minimum size=1cm,draw,circle] {M};
\draw [red, ultra thick] (-0,-8.1) node[minimum size=1cm,draw,circle] {K};
\draw [red, ultra thick] (2,-4.1) node[minimum size=1cm,draw,circle] {D};
\draw[->] (2,-4.6) -- (1,-5.6);
\draw [red, ultra thick] (1,-6.1) node[minimum size=1cm,draw,circle] {G};
\draw[->] (2,-4.6) -- (2,-5.6);
\draw [red, ultra thick] (2,-6.1) node[minimum size=1cm,draw,circle] {H};
\draw[->] (2,-4.6) -- (4,-5.6);
\draw[->] (2,-6.6) -- (2,-7.6);
\draw [red, ultra thick] (2,-8.1) node[minimum size=1cm,draw,circle] {L};
\draw[->] (2,-8.6) -- (2,-9.6);
\draw [red, ultra thick] (-0,-10.1) node[minimum size=1cm,draw,circle] {N};
\draw[->] (2,-8.6) -- (-0,-9.6);
\draw [red, ultra thick] (2,-10.1) node[minimum size=1cm,draw,circle] {O};
\draw [red, ultra thick] (4,-6.1) node[minimum size=1cm,draw,circle] {I};
\end{tikzpicture}
\end{document}
Nodes with edges
\documentclass{article}
\usepackage{tikz}
\begin{document}
\begin{tikzpicture}
\draw [red, ultra thick] (0,-2) node[minimum size=1cm,draw,circle] {A};
\draw[->] (0,-2.5) -- (-2,-3.5);
\draw[->] (0,-2.5) -- (-0,-3.5);
\draw[->] (0,-2.5) -- (2,-3.5);
\node [purple,below] at (0,-1) {Node A};
\node [purple,below] at (0,-3.6) {edge};
\node [purple,below] at (-2,-3.6) {edge};
\node [purple,below] at (2,-3.6) {edge};

\end{tikzpicture}
\end{document}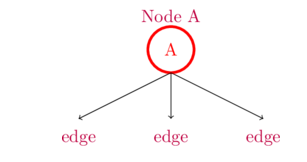
we can write 6825.8 as 6825.8 base 10
\documentclass{article}
\usepackage{tikz}
\begin{document}
\begin{tikzpicture}[outline/.style={draw=#1,thick,fill=#1!50}]
\node [left,red][yshift=0cm] at (-0.8,-0.4) {$ + $ };
\node [left,red][yshift=0cm] at (-2.8,-0.4) {$ + $ };
\node [left,red][yshift=0cm] at (-4.8,-0.4) {$ + $ };
\node [left,red][yshift=0cm] at (-6.8,-0.4) {$ + $ };
\node [left,red][yshift=-4cm] at (-3,-0.4) {6 8 2 5 . 8 };
\draw (0,-0.5) --(-3,-4);
\draw (-2,-0.5) --(-3.6,-4);
\draw (-4,-0.5) --(-4.2,-4);
\draw (-6,-0.5) --(-4.6,-4);
\draw (-8,-0.5) --(-5,-4);
\node [outline=cyan] at (-8,-0.4) {$6*10^3$};
\node [outline=cyan] at (-6,-0.4) {$8* 10^2$};
\node [outline=cyan] at (-4,-0.4) {$2*10^1$};
\node [outline=cyan] at (-2,-0.4) {$5*10^0$};
\node [outline=cyan] at (0.0,-0.4) {$8*10^-1$};
\end{tikzpicture}
\end{document}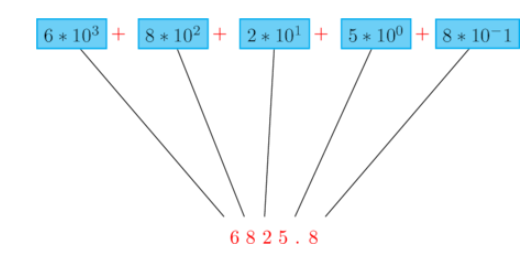
decimal to the binary conversion of 6825.3666
\documentclass{article}
\usepackage{tikz}
\begin{tikzpicture}[xscale=3, yscale=1.5]
\draw [thick, -] (0,0.4) -- (0,0) -- (0.4,0);
\node [left] at (0,0.2) {$2$};
\node[above right] (.8,.8) {$3412 \longrightarrow 1$};
\draw [thick, -][yshift=0.4cm] (0,0.4) -- (0,0) -- (0.4,0);
\node [left][yshift=0.6cm] at (0,0.2) {$2$};
\node[above right] [yshift=0.6cm](.5,.8) {$6825$};
\draw [thick, -][yshift=-0.4cm] (0,0.4) -- (0,0) -- (0.4,0);
\node [left][yshift=-0.6cm] at (0,0.2) {$2$};
\node[above right] [yshift=-0.6cm](.5,.8) {$1706 \longrightarrow 0$};
\node[above right] [yshift=-1.2cm](.5,.8) {$853\ \ \longrightarrow 0$};
\draw [thick, -][yshift=-0.8cm] (0,0.4) -- (0,0) -- (0.4,0);
\node [left][yshift=-1.2cm] at (0,0.2) {$2$};
\node[above right] [yshift=-1.8cm](.5,.8) {$426\ \ \longrightarrow 1$};
\draw [thick, -][yshift=-1.2cm] (0,0.4) -- (0,0) -- (0.4,0);
\node [left][yshift=-1.8cm] at (0,0.2) {$2$};
\node[above right] [yshift=-2.4cm](.5,.8) {$213\ \ \longrightarrow 0$};
\draw [thick, -][yshift=-1.6cm] (0,0.4) -- (0,0) -- (0.4,0);
\node [left][yshift=-2.4cm] at (0,0.2) {$2$};
\node[above right] [yshift=-3cm](.5,.8) {$106\ \ \longrightarrow 1$};
\draw [thick, -][yshift=-2cm] (0,0.4) -- (0,0) -- (0.4,0);
\node [left][yshift=-3cm] at (0,0.2) {$2$};
\node[above right] [yshift=-3.6cm](.5,.8) {$53\ \ \ \longrightarrow 0$};
\draw [thick, -][yshift=-2.4cm] (0,0.4) -- (0,0) -- (0.4,0);
\node [left][yshift=-3.6cm] at (0,0.2) {$2$};
\node[above right] [yshift=-4.2cm](.5,.8) {$26\ \ \ \longrightarrow 1$};
\draw [thick, -][yshift=-2.8cm] (0,0.4) -- (0,0) -- (0.4,0);
\node [left][yshift=-4.2cm] at (0,0.2) {$2$};
\node[above right] [yshift=-4.8cm](.5,.8) {$13\ \ \ \longrightarrow 0$};
\draw [thick, -][yshift=-3.2cm] (0,0.4) -- (0,0) -- (0.4,0);
\node [left][yshift=-4.8cm] at (0,0.2) {$2$};
\node[above right] [yshift=-5.4cm](.5,.8) {$6\ \ \ \ \longrightarrow 1$};
\draw [thick, -][yshift=-3.6cm] (0,0.4) -- (0,0) -- (0.4,0);
\node [left][yshift=-5.4cm] at (0,0.2) {$2$};
\node[above right] [yshift=-6cm](.5,.8) {$3\ \ \ \ \longrightarrow 0$};
\draw [thick, -][yshift=-4cm] (0,0.4) -- (0,0) -- (0.4,0);
\node [left][yshift=-6cm] at (0,0.2) {$2$};
\node[above right] [yshift=-6.6cm](.5,.8) {$1\ \ \ \ \longrightarrow 1$};
\draw [->,red] [yshift=-5.5cm](0,0.8) -- (0.8,0.8);
\draw [<-,red] [yshift=-1.8cm](0.8,2) -- (0.8,-2.9);
\node[above right,cyan] [yshift=-7.5cm](.5,.8) {MSD};
\node[above right,cyan] at (0.8,0.1) {LSD};
\end{tikzpicture}
\end{document}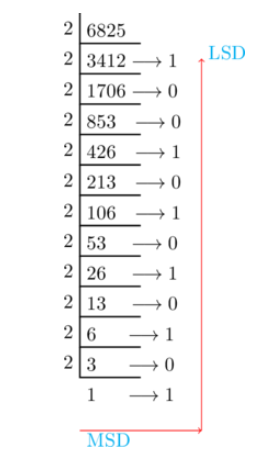
Binary to Decimal conversion
\documentclass{article}
\usepackage{tikz}
\begin{document}
\begin{tikzpicture}
\definecolor{blue1}{HTML}{6095C9}
\definecolor{blue2}{HTML}{55779A}
\matrix [column sep=10mm, row sep=8mm, every node/.style={
    shape=rectangle,text width=2cm, minimum height=2cm,text centered,
    font=\sffamily\small, very thick,color=black,draw=black,fill=yellow,
}] {
  \node (a1) {1 \ 1 \ 0 \ 1 \   \ \ \   \  \  \  \ \  \ \ \ \ $2^3$ $2^2 $ $2^1$ $2^0$ }; &

   \\
};
\end{tikzpicture} \\
\begin{tikzpicture}
\definecolor{blue1}{HTML}{6095C9}
\definecolor{blue2}{HTML}{55779A}
\matrix [column sep=10mm, row sep=8mm, every node/.style={
    shape=rectangle,text width=5cm, minimum height=0.8cm,text centered,
    font=\sffamily\small, very thick,color=black,draw=black,fill=yellow,
}] {
  \node (a1) {1x$2^0$+0x$2^1$+1x$2^2$+1x$2^3$}; &

   \\
};
\end{tikzpicture} \\
\begin{tikzpicture}
\definecolor{blue1}{HTML}{6095C9}
\definecolor{blue2}{HTML}{55779A}
\matrix [column sep=10mm, row sep=8mm, every node/.style={
    shape=rectangle,text width=2.5cm, minimum height=0.8cm,text centered,
    font=\sffamily\small, very thick,color=black,draw=black,fill=yellow,
}] {
  \node (a1) {1+0+4+8=13}; &

   \\
};
\end{tikzpicture}
\end{document}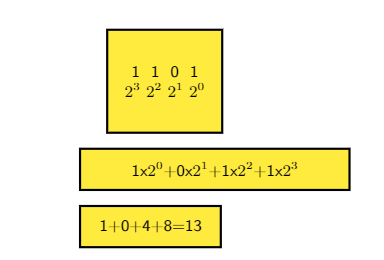
Rotate eclipse vertically
\documentclass{article}
\usepackage{tikz}
\begin{document}
\begin{tikzpicture}
\draw (-3,-3.5) ellipse (30pt and 80pt);
\end{tikzpicture}
\end{document}
Rotate eclipse 45 degree
\documentclass{article}
\usepackage{tikz}
\begin{document}
\begin{tikzpicture}
\draw [rotate=45](-3,-3.5) ellipse (30pt and 80pt);
\end{tikzpicture}
\end{document}
Rotate text
\documentclass{article}
\usepackage{tikz}
\begin{document}
\begin{tikzpicture}
\node [rotate=90] at (-2,0) {Tree example has nodes from A to O};
\end{tikzpicture}
\end{document}
Alternating current
\documentclass{article}
\usepackage{tikz}
\begin{document}
\begin{tikzpicture}
    \draw [purple,<-] (4,4) -- (4,-2);
\draw [purple,->] (2,0) -- (12,0);
   \node at (4,4.5) {i};
\node at (12.5,0) {t};
\node at (9.5,1) {Current};
\node  at (9,00.5) {$\nearrow$};
    \draw[ultra thick, red] (3,0) sin (4,1);
    \draw[ultra thick, blue] (4,1) cos (5,0);
    \draw[ultra thick, red] (5,0) sin (6,-1);
    \draw[ultra thick, blue] (6,-1) cos (7,0);
    \draw[ultra thick, red] (7,0)  sin (8,1);
    \draw[ultra thick, blue] (8,1) cos (9,0);
    \draw[ultra thick, red] (9,0) sin (10,-1);
    \draw[ultra thick, blue] (10,-1) cos (11,0);
    \end{tikzpicture}
\end{document}
Open circuit
\documentclass{article}
\usepackage{tikz}
\usepackage{circuitikz}
\usetikzlibrary{circuits.logic.US}
\usepackage{tikz}
\begin{document}
\begin{tikzpicture}[circuit logic US, every circuit symbol/.style={thick}]

	\node[and gate,inputs={nnnn}, point right] (and3) at (3,-1)    {};
\draw [fill=white] (-1.5,-2.8) circle [radius=0.1];
\draw [fill=white] (0.0,-2.8) circle [radius=0.1];
\draw [purple] (1.5,-0.8) -- (2.5,-0.8);
\draw [purple] (1.5,-1.2) -- (2.5,-1.2);
\draw [purple] (1.5,-0.8) -- (1.5,1);
\draw [purple] (1.5,-1.2) -- (1.5,-2.8);
\draw [purple] (1.5,1) -- (-3,1);
\draw [purple] (1.5,-2.8) -- (0,-2.8);
\draw [purple] (-3.0,-2.8) -- (-1.5,-2.8);
\draw [purple] (-3.0,-2.8) -- (-3.0,0);
\draw [purple] (-3.0,1) -- (-3.0,0.2);
%voltage symbol
\draw [purple] (-3.2,0) -- (-2.8,0);
\draw [purple] (-3.4,0.2) -- (-2.6,0.2);
\draw [purple] (-1.5,-2.8) -- (-1,-1.5);
\node [blue] at (3,-2.0) {Led bulb};
\node [red] at (-3.5,0) {-};
\node [red] at (-3.5,0.3) {+};
\node [red] at (-4.5,0) {Battery};
\node [orange] at (-1.5,-3.5) {Switch opened };
\end{tikzpicture}
\end{document}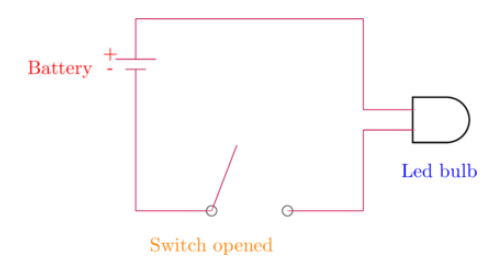
circuitikz
See some circuitikz examples from here —–>
\documentclass{article}
\usepackage{tikz}
\usepackage{circuitikz}
\begin{document}
\begin{tikzpicture}
\tikz{
  \draw (0,1) to [battery1,] (0,0)--(0,-2)to (0,-2) -- (4,-2);
\draw(0,1)--(2,1)  to[R=$R$](4,1);
\draw(4,0)--(4,1) to[full led] (4,-2)
  }
\node [red] at (1,1) {Led bulb};
\node [red] at (-5,3) {5V};
\end{tikzpicture}
\end{document}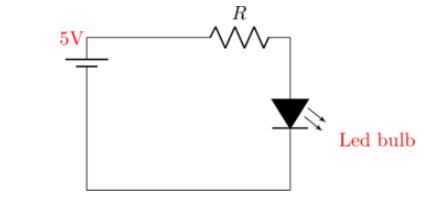
Leave a Reply